Can sonification aid the perception of complex visual networked data?
Conference Paper AVI 2026
Maurizio Berta, Roberto Bresin and Gaël Dubus
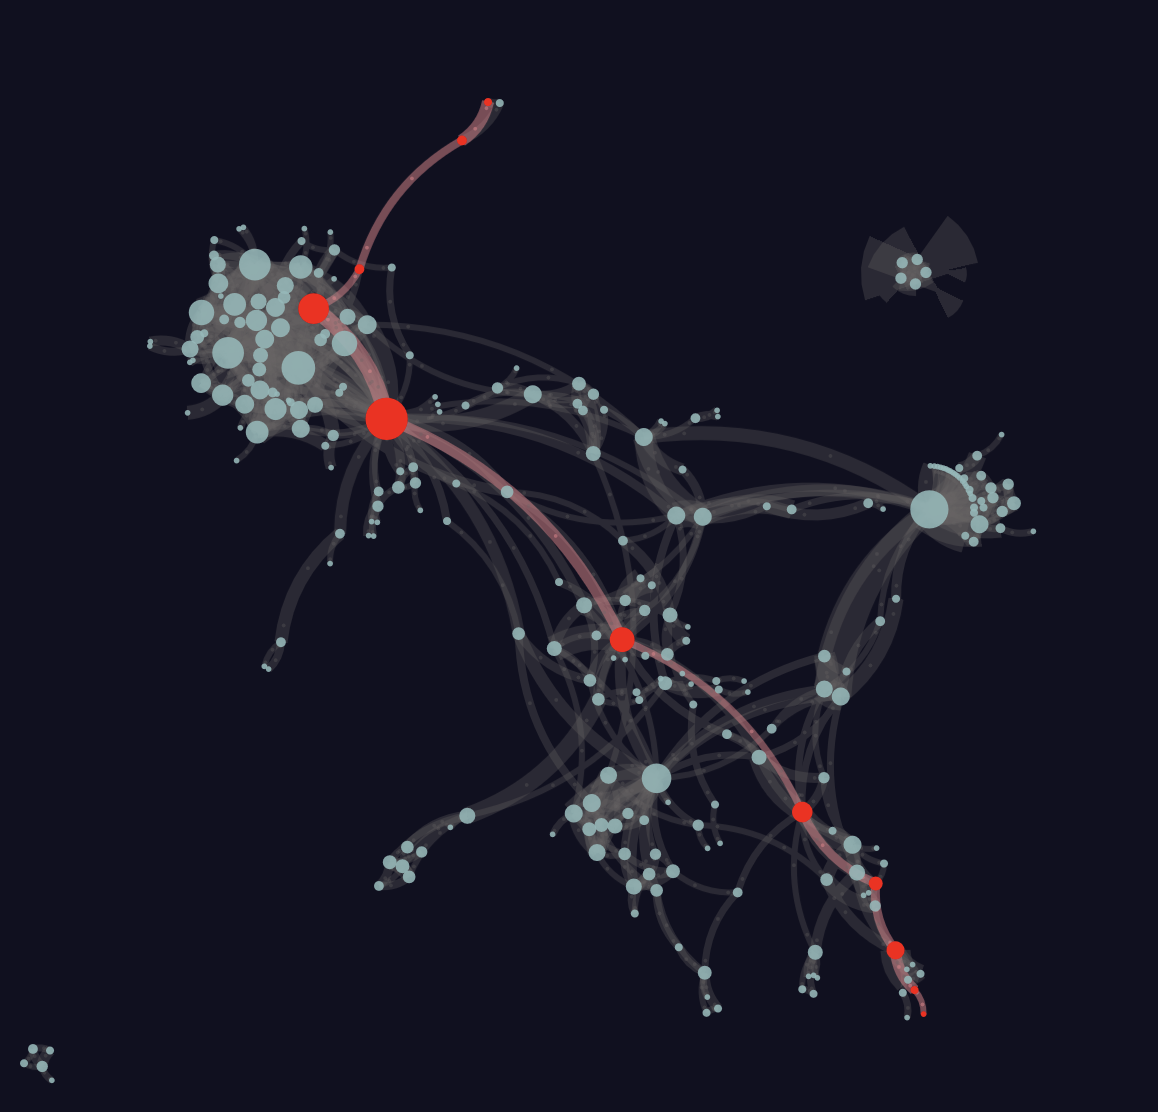
A side effect of the exponential growth of scientific publications is the generation of large bibliometric databases, dense with metadata. The communication and understanding of these data is complex but can be improved through multimodal representations and interactive exploration. Previous interactive solutions for bibliometric databases rely mainly on visual representations. However, these representations tend to be hard to read, especially when working with large databases. Multisensory perception research suggests that an overloaded visual channel can be supported with auditory cues. Following this principle, we propose an interactive web-based tool that supports visual representation of bibliometrics through an interactive sonification system. The tool combines visual graph representation with three interactive sonification strategies, each designed to highlight different aspects of the publications represented in the graph. This interface allows users to interactively transform bibliometric parameters into sound features that reveal citation patterns and scholarly relationships.
We conducted a think-aloud test with bibliometricians and UX designers to evaluate the tool, and an online perceptual experiment to evaluate our sonification mapping strategies. Results of the think-aloud test show that auditory display can aid and complement bibliometrics visualization. Results of the online experiment show consistent mapping preferences coherent with shared principles of multisensory perception, e.g., large-sized nodes represented by low-pitched sounds, across different interaction modes and speeds. In conclusion, our tool marks a starting point for the use of sonification in the interactive exploration of complex networked databases.